If you turn to Google on how to convert an image (e.g. a JPEG) to grayscale, almost all solutions you will find will cycle through all pixels individually to convert them to a luminance value:
Read more...Textured Gradients in Pure CSS
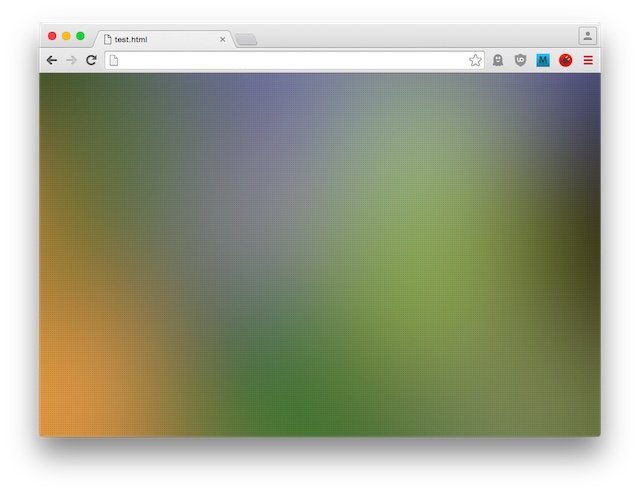
We’re going to create a background like this in pure CSS:

Generating Colour Palettes for Charts
I recently had to find a way to generate colours for charts. Specifically, the series in a chart — typically visualized using bars, lines, dots, or areas — are often distinguished using different colours which, for the most part, should be generated and assigned automatically. And while d3.js (on which the chart code was based) offers some pre-defined colour schemes which consequently happen to be used in most d3.js-based projects, they were quite limited for what I needed.
Read more...